


Whether you are new to crypto trading or an experienced trader, it’s very important to have the right skills and tools for reading crypto charts. Let’s begin with listing the top charting tools.
Top Charting Tools For Crypto Traders
TradingView
TradingView is the most popular charting and technical analysis tool for reading crypto chart across all markets. They have worked hard in recent years to connect their toolkit with the leading Bitcoin exchanges, and the outcomes are remarkable. Their online charting tools are available to both free and premium customers.
Also a free account should suffice for most traders to get started and learn the fundamentals of technical analysis. While premium users have more technical indicators, free customers still have access to the same professional tools as pro users.
Cryptoview
CryptoView stands out as the greatest cryptocurrency charting software, with an easy-to-use online trading and chart analysis platform. Its comprehensive cryptocurrency portfolio manager and multi-exchange-free utilities make it usable by all users, regardless of skill level.
Real-time trading is made possible by the multi-charting interface, which offers several free cryptocurrency charts with indicators. There are also additional features like notifications, top-notch security features, sophisticated order options, and sketching tools. Users can easily traverse the ever-changing cryptocurrency ecosystem, utilizing a variety of tools to improve their trading experience.
Coinigy
Coinigy is a cryptocurrency charting tool, and while it’s not free, it’s a robust tool that can give useful insights and analytics into the crypto market from more than 45 exchanges. Coinigy’s user-friendly layout may be appealing to investors unfamiliar with charting tools. The platform has a simple and user-friendly interface that allows users to maintain their portfolios, and observe market trends.
And for those concerned about the safety and security of their cryptocurrency investments, Coinigy adheres to industry best practices. All user data is safeguarded with AES 256-bit encryption. Every request is routed over a certified and secure SSL, 2FA with TOTP is available, and each login is timestamped with an IP address and authentication email.
Popular Crypto Chart Types
While there are many other kinds of cryptocurrency charts, line, bar, and candlestick charts are the most widely used varieties. Though each form provides a different set of insights, candlestick charts are the most often used because they provide a full depiction of the price activity, including the open, high, low, and closing values.
Candlestick diagrams
Candlestick charts was Munehisa Homma, a Japanese rice merchant developed in Japan in the 18th century. He invented them to observe rice price changes as they gave a visual picture of price patterns and market mood, allowing traders to make more educated decisions. Candlestick charts were eventually brought to the Western world and have become a popular tool for financial research. Hence, the reason candlestick charts are the most well-liked and often used charts in crypto trading is probably because they present the data in a comprehensible manner.
Every candlestick displays the opening, closing, high, and low prices for a certain time period. Because the candlestick body is colored, it is simple to see if the price closed higher or lower than it opened (green for up periods and red for down periods). The lowest and greatest prices over that time period are represented by the wicks at the bottom and top, respectively. Candlestick charts for cryptocurrencies are useful for spotting patterns and trends that point to possible changes in the market’s price.
Recognizing support and resistance
One of the most important aspects of reading a cryptocurrency chart is recognizing support and resistance. A price level that an asset does not drop below for a predetermined amount of time is referred to as a support level in charts. The price at which the asset is not anticipated to climb any higher is referred to as the resistance level, in contrast. This is the point in the market where there are more sellers than buyers of a specific digital asset. Experts frequently recommend support and resistance levels to help traders when they take positions in cryptocurrencies.
Step-by-Step Process for Reading Crypto Charts
1. Choose Your Chart Style: The first thing to do is to pick a chart style that best suits your needs. The line charts is for a simple look, bar charts is for greater depth, and candlestick charts is for a thorough study.
2. Look at the axes: You should become familiar with the axes as the vertical axis indicates price, and the horizontal axis represents time. This can help you understand how prices have evolved.
3. Look for Trends: Determine whether the price is typically trending upwards, downwards, or sideways. Recognizing patterns such as higher highs or lower lows can help identify bullish or bearish trends.
4. Check Volume: Look at the volume bars to see how many units are being exchanged. High trading volume can indicate substantial price fluctuations, whilst low volume may indicate a lack of interest.
5. Determine Key Levels: Locate support and resistance levels where prices tend to bounce back or reverse. These levels might be important for making trading decisions.
6. Use Technical Indicators: You should technical indicators such as moving averages or RSI to help you improve your research and identify suitable entry or exit opportunities.
7. Practice Regularly: Like they say practice makes perfect. The more you practice reading charts, the better you’ll get at analyzing market signals and making educated decisions.
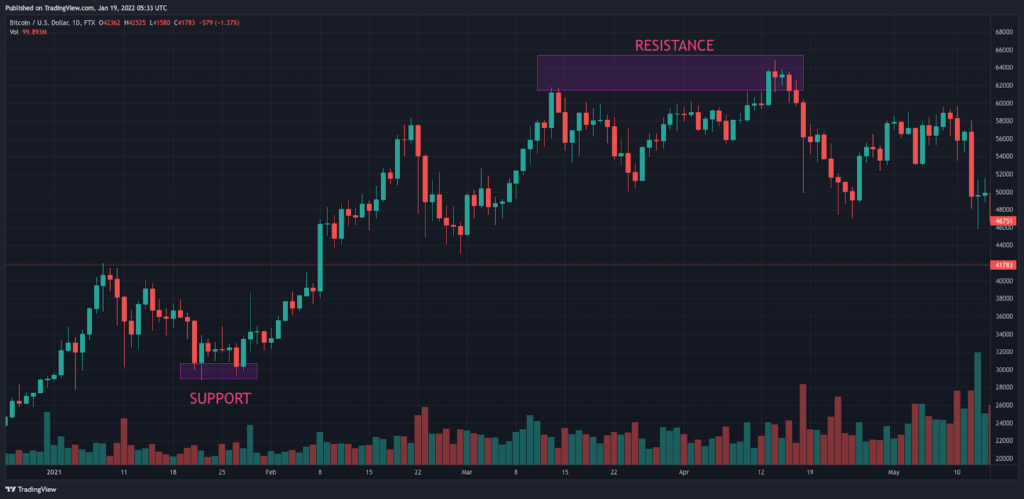
Photo credit: YouHodler
Conclusion
Crypto charts are powerful tools that provide insights into cryptocurrency patterns, allowing you to make more educated investing decisions. You become more confident if you are familiar with various chart styles and use technical analysis to assess market movements. Remember that practice makes perfect, so spend time studying and analyzing cryptocurrency charts to hone this crucial ability.